

Why a data‑driven metrology matters
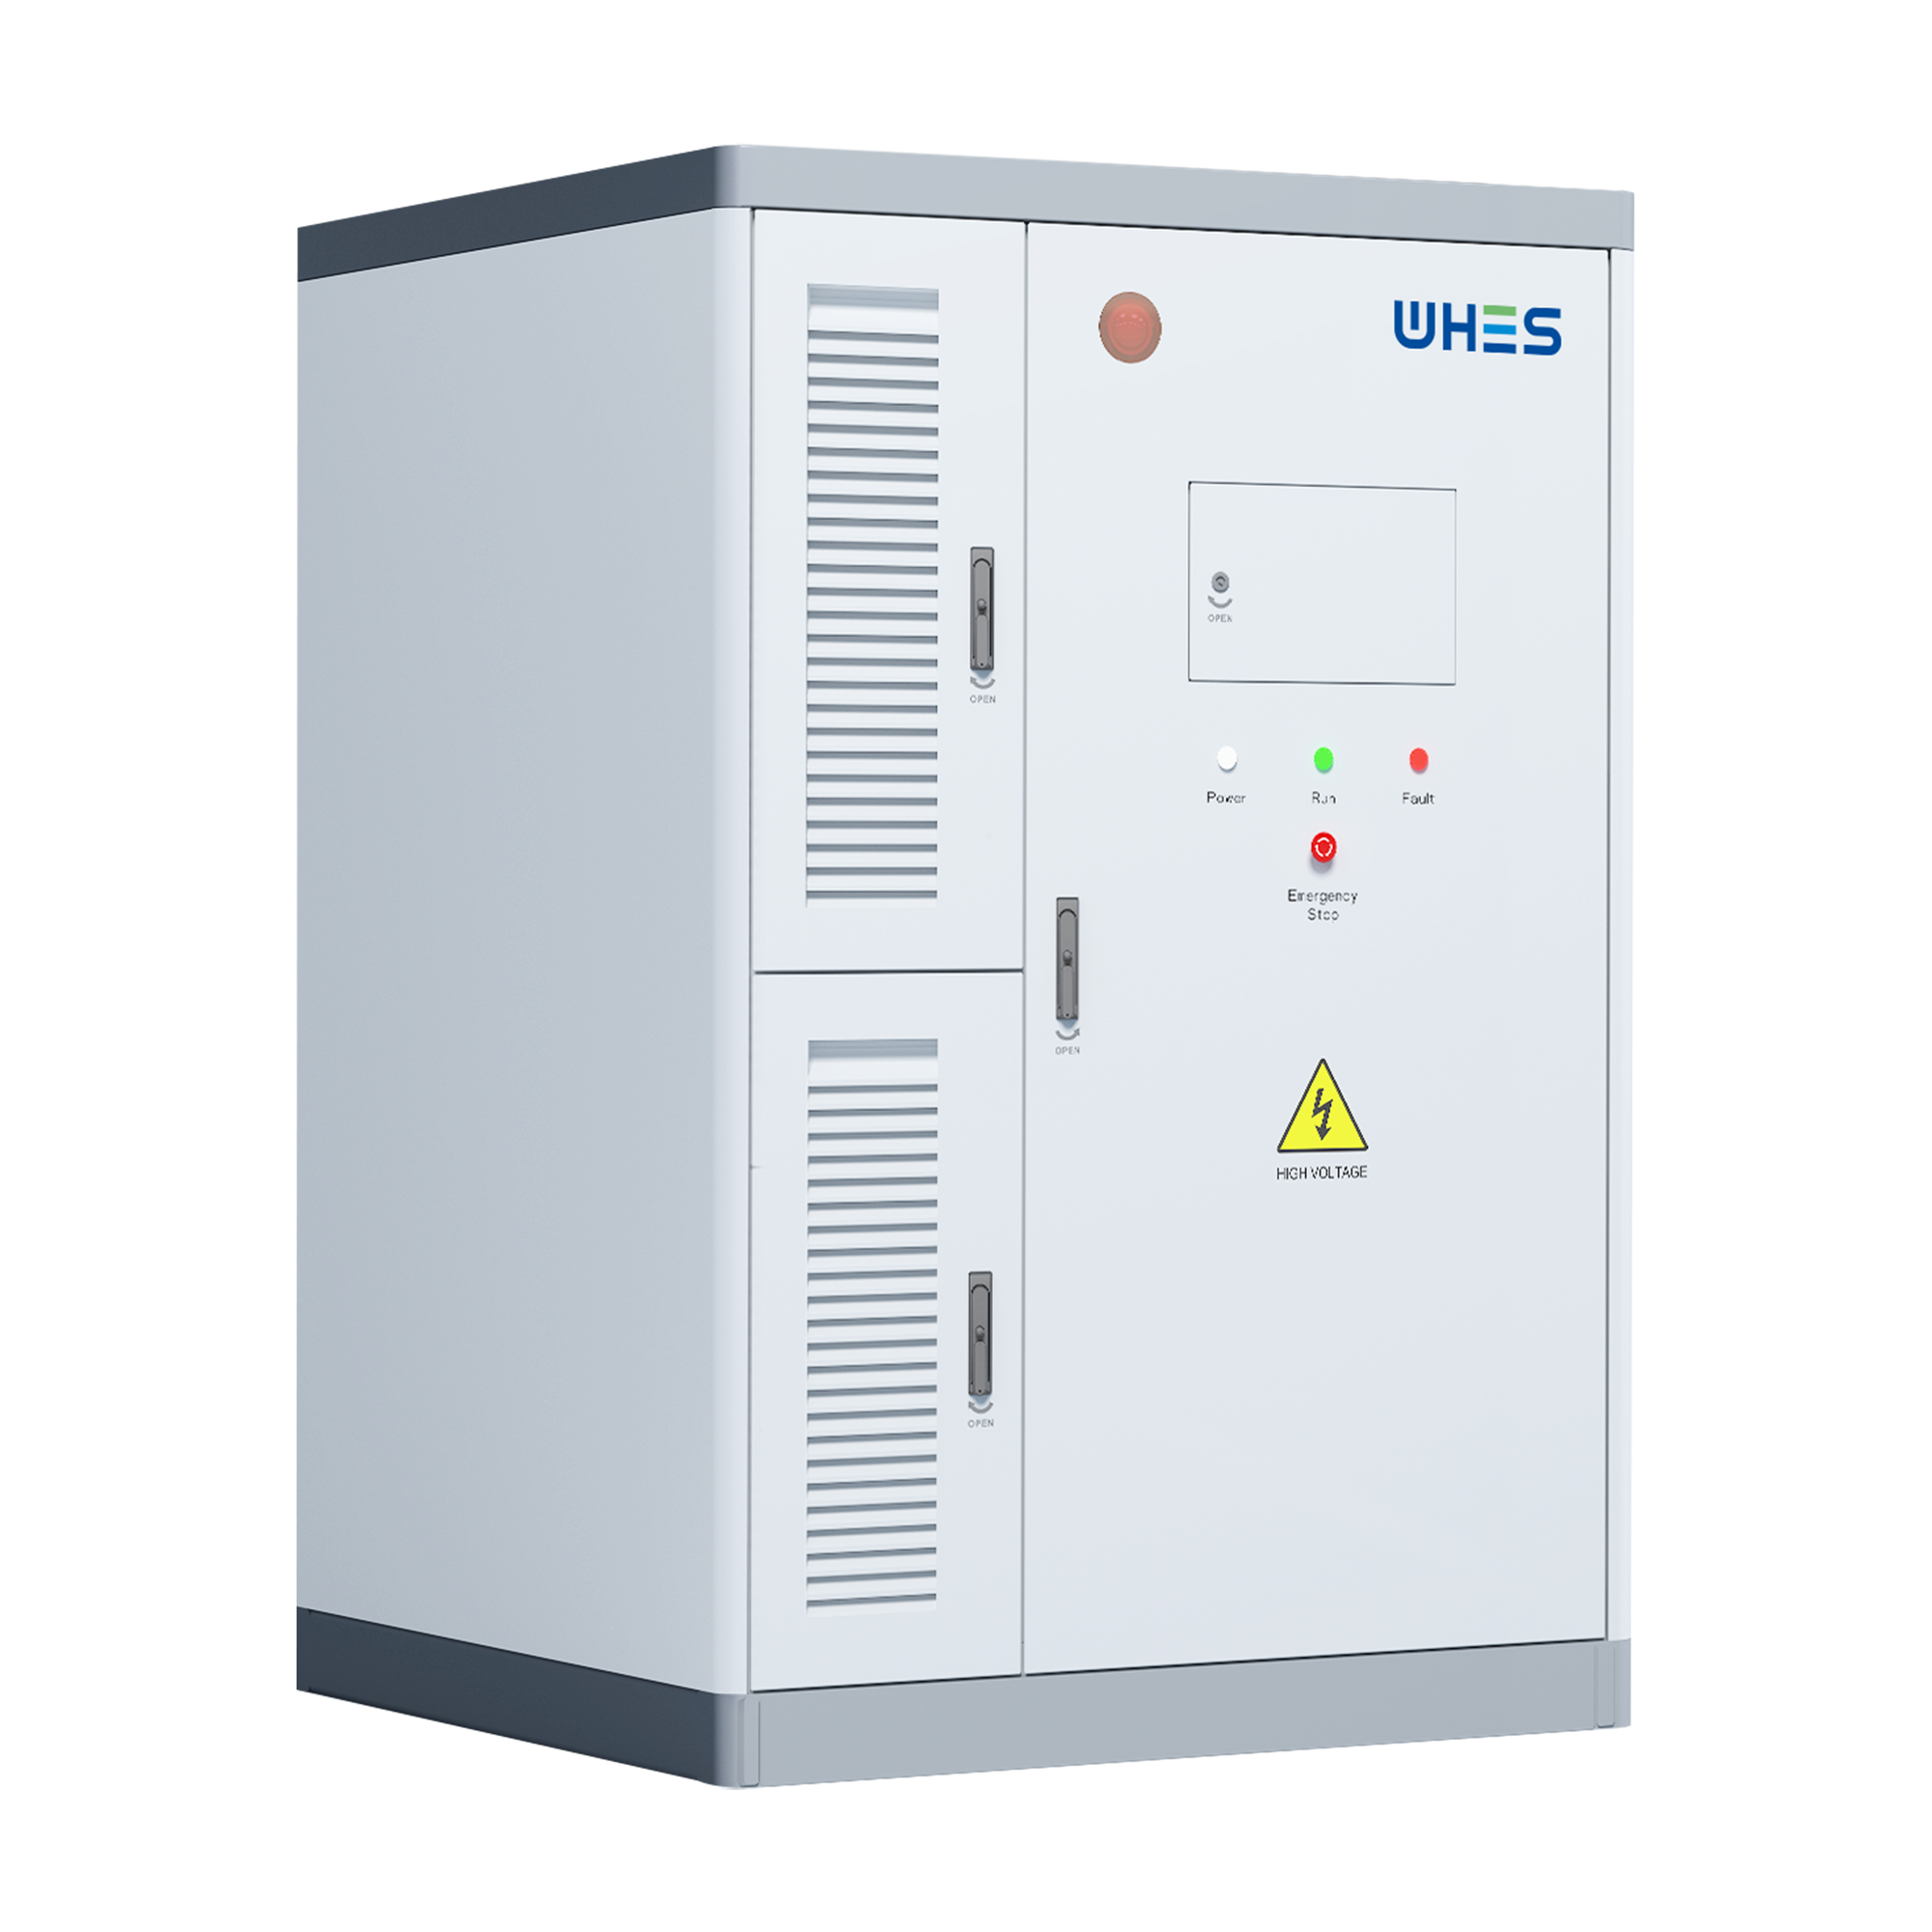
In product R&D you cannot rely on estimates — must measure. A data‑driven metrology approach gives teams clear numbers for round‑trip efficiency and parasitic or auxiliary load draws, so your designs actually meet SLAs and O&M expectations. For commercial deployments this is especially critical: modern commercial battery storage systems are managed against tariffs, outage scenarios, and lifecycle costs, so instrumenting for fidelity up front saves real money later. See also practical examples from commercial battery storage pilots that report measurable gains in dispatch accuracy and lifecycle projections.
Core metrics to capture
Keep measurements concise and comparable. The essentials are: round‑trip efficiency (energy out ÷ energy in), auxiliary load (continuous draws from BMS, thermal management, pumps), inverter losses (power conversion inefficiency), and state‑of‑charge (SoC) drift over time. Use standard units (kWh for energy, W for steady draws) and sample at sufficient frequency to catch transient behaviors — 1 Hz is often a good starting point for system‑level tests. These metrics help you calibrate models and inform procurement specs like depth‑of‑discharge (DoD) limits and charger/inverter ratings.
How to design repeatable tests
Design tests that mimic intended operational profiles: peak shaving cycles, daily arbitrage, and backup discharge ramps. Use controlled charge/discharge sequences with known step profiles so you isolate inverter switching losses from cell chemistry inefficiencies. Also log auxiliary loads during idle, standby, and active cooling cycles — many teams undercount fans, contactor heaters, or comms modules. For repeatability, define temperature, SoC windows, and ramp rates in the test protocol; don’t just say “nominal conditions.”
Instrumentation and data hygiene
Choose metrology tools that match the scale: high‑precision energy meters for system‑level round‑trip checks, clamp meters for branch currents, and temperature sensors near hottest cells. Synchronise clocks across devices (NTP or GPS) to align events. Record metadata: firmware versions, inverter topologies, and battery chemistry. Keep sampling resolution high enough to see switching transients but balance data storage and processing overhead. One practical trick — log both raw and aggregated data streams so you can reprocess without repeated tests.
Common pitfalls — and quick fixes
Teams regularly make the same mistakes: assuming inverter datasheet numbers match field behavior; ignoring auxiliary draws during quiescent periods; and treating SoC estimation as exact. The usual fixes are simple: validate inverter efficiency across real load curves, meter auxiliary systems independently, and calibrate SoC estimation with coulomb counting plus periodic full‑cycle verifications. — Also, don’t let short‑duration tests mask thermal effects that show up only after hours of cycling.
Real‑world anchor: lessons from California deployments
Field programmes in California during recent wildfire seasons showed why measurement matters: many commercial projects installed battery systems primarily for backup and frequency services, only to find that unmetered auxiliary draws and conservative SoC margins reduced usable capacity in critical events. Public reporting and utility filings from these deployments highlighted mid‑80s to low‑90s percent round‑trip efficiencies for modern li‑ion systems under field conditions — a useful baseline when you benchmark designs. This kind of anchor helps you set realistic performance targets and procurement acceptance tests.
Integrating metrology into R&D workflows
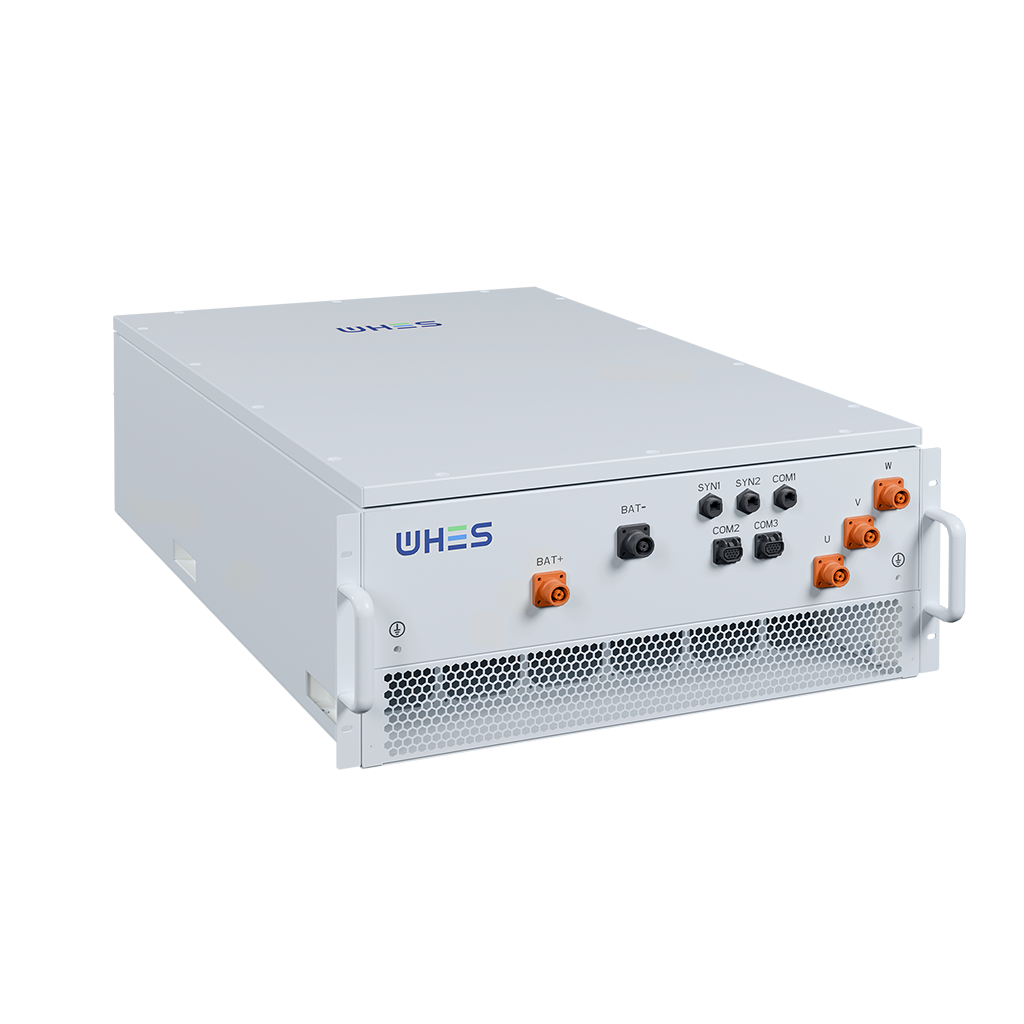
Metrology should be embedded in the design loop: early prototypes go through a standard test suite, results feed simulation models, and iterations follow. Version control for test scripts, and automated analysis pipelines, speed iteration — especially when you combine physical testing with digital twin runs. When moving from lab to field, ensure your test protocol scales to full‑stack environments and aligns with the expectations of c&i installers and asset owners; linking lab metrics to field KPIs is how you turn measurements into commercial value. Consider connecting to real system management stacks used in c&i battery storage projects so telemetry maps to operational dashboards.
Comparative checks and validation strategy
Run comparative checks: lab vs. bench vs. field. If lab results differ from field by more than a few percentage points, hunt thermal effects, cabling losses, and auxiliary draws first. Validation should include worst‑case scenarios — low ambient temperatures, partial SoC windows, and emergency dispatches — because those are when margins matter. Use regression tests periodically; treat them like unit tests for your powertrain. If a supplier claims 95% round‑trip, demand the test protocol and reproduce at your scale.
Advisory: three golden rules for metrology in ESS R&D
1) Measure the whole system, not components: always include inverters, fans, comms, and contactors in energy accounting so round‑trip figures reflect reality. 2) Standardise protocols: define temperature, SoC bands, ramp rates, and sampling frequency so comparisons are apples‑to‑apples. 3) Tie metrics to commercial use cases: translate efficiency and auxiliary draws into revenue impacts (dispatch profitability, backup capacity) before finalising designs.
The bench tests, field lessons, and calibrated models all point to one practical truth: accurate metrology turns design assumptions into commercial confidence — a capability that companies like WHES bring to system design and deployment. —